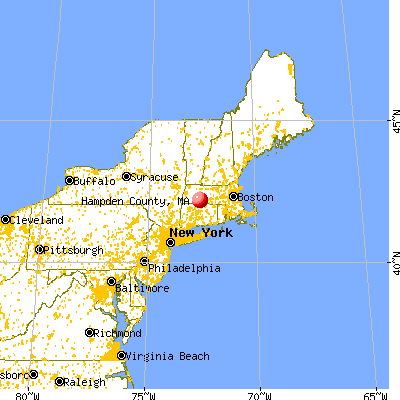
Holyoke Mall Crossing
at the crossroads of New England
Holyoke Mall Crossing
at the crossroads of New England
County population in July 2009: 471,081 (90% urban, 10% rural)County owner-occupied houses and condos:
108,524Renter-occupied apartments: 66,764
% of renters here: 38%State: 36%Land area: 618 sq. mi.Water area:
15.7 sq. mi.
Population density:
762 people per square mile (high)
Jan. 2011 cost of living index in Hampden County:114.1 (more than average, U.S. average is 100)
We are giving away a $200 prize -enter simply by sending us your own pictures of this county!
Educational,health and social services (23.7%), Manufacturing (16.5%), Retail trade (12.4%).
Type of workers:- Private wage or salary: 78%
- Government: 17%
- Self-employed, not incorporated: 5%
- Unpaid family work: 0%
- Private wage or salary: 78%
- Government: 17%
- Self-employed, not incorporated: 5%
- Unpaid family work: 0%
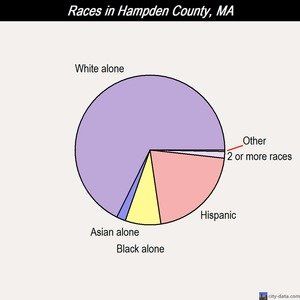
Races in Hampden County, Massachusetts:- White Non-Hispanic Alone (70.7%)
- Hispanic or Latino (18.5%)
- Black Non-Hispanic Alone (7.7%)
- Asian alone (1.7%)
- Two or more races (1.0%)
Median resident age: 36.4 yearsMassachusetts median age: 36.5 yearsMales: 218,493 (47.9%)Females: 237,735 (52.1%)
- White Non-Hispanic Alone (70.7%)
- Hispanic or Latino (18.5%)
- Black Non-Hispanic Alone (7.7%)
- Asian alone (1.7%)
- Two or more races (1.0%)
Median resident age: 36.4 years
Massachusetts median age: 36.5 years
Males: 218,493 (47.9%)
Females: 237,735 (52.1%)
Average household size:
Hampden County: 2.5 people
Massachusetts: 3 people
Massachusetts: 3 people
Estimated median household income in 2009: $46,809 ($39,718 in 1999)
This county: $46809
Massachusetts: $64081
Median contract rent in 2009 for apartments:$619 (lower quartile is $411, upper quartile is $768)
This county: $619State: $864
Estimated median house or condo value in 2009:$200,200 (it was $113,700 in 2000)
Hampden County: $200,200
Massachusetts: $338,500
Lower value quartile - $154,500Upper value quartile: - $265,200
Mean price in 2009:Detached houses:
$236,621
Here: $236,621State: $412,156
Townhouses or other attached units: $189,283
Here: $189,283
State:
$346,236
In 2-unit structures: $190,102
Here: $190,102
State:
$348,924
In 3-to-4-unit structures: $193,779
Here: $193,779
State:
$354,648
In 5-or-more-unit structure: $140,893
Here: $140,893
State:
$326,862
Mobile homes: $58,415
Here: $58,415
State:
$71,966
Median monthly housing costs for homes and condos with a mortgage: $1,560Median monthly housing costs for units without a mortgage:
$557Institutionalized population:
7,432
(413) 563-1100
Health of residents in Hampden County based on CDC Behavioral Risk Factor Surveillance System Survey Questionnaires from 2003 to 2009:
General health status score of residents in this county from 1 (poor)
to 5 (excellent)
is 3.4.This is significantly worse than average.
69.2% of residents exercised in the past month. This is less than average.
50.6% of residents smoked 100+ cigarettes in their lives. This is about average.
81.9% of adult residents drank alcohol in the past 30 days. This is more than average.
72.1% of residents visited a dentist within the past year. This is about average.
Average weight of males is 195 pounds. This is about average.
Average weight of females is 165 pounds. This is more than average.
12.6% of residents keep firearms around their homes. This is less than average.
Single-family new house construction building permits:
• 2007: 575 buildings, average cost: $189,200
• 2008: 312 buildings, average cost: $202,400
• 2009: 292 buildings, average cost: $188,100
• 2008: 312 buildings, average cost: $202,400
• 2009: 292 buildings, average cost: $188,100
Median real estate property taxes paid for housing units with mortgages in 2009: $2,754 (1.4%)
Median real estate property taxes paid for housing units with no mortgage in 2009: $2,709 (1.4%)
Detailed 2008 Election Results- Obama (Democratic): 61.4%
- McCain (Republican): 36.1%
- Obama (Democratic): 61.4%
- McCain (Republican): 36.1%
Percentage of residents living in poverty in 2009: 17.3%
(8.7% for White Non-Hispanic residents, 27.8% for Black residents, 42.7% for Hispanic or Latino residents, 46.6% for other race residents)
(8.7% for White Non-Hispanic residents, 27.8% for Black residents, 42.7% for Hispanic or Latino residents, 46.6% for other race residents)
Hampden County: 17.3%
Massachusetts: 10.3% (8.7% for White Non-Hispanic residents, 27.8% for Black residents, 42.7% for Hispanic or Latino residents, 46.6% for other race residents)
Median age of residents in 2009: 38 years old(Males: 36 years old, Females:
40 years old)
(Median age for: White residents: 44 years old,
Black residents: 31 years old,
American Indian residents: 19 years old,
Asian residents: 31 years old, Hispanic or Latino residents:
24 years old, Other race residents: 24 years old)
Area name: Springfield, MA HUD Metro FMR Area
Fair market rent in 2006 for a 1-bedroom apartment in Hampden County is $629 a month.
Fair market rent for a 2-bedroom apartment is $799 a month.
Fair market rent for a 3-bedroom apartment is $956 a month.
Notable locations in this county outside city limits:
Notable locations in Hampden County: Ludlow Country Club (A), Ludlow Shopping Plaza (B), Appalachian Mountain Club (C), Quaboag Valley Golf Course (D), Sodom Mountain Campground (E), Sodom Mountain Ski Area (F), Barber Camp (G), Southwick Country Club (H), Springfield Boys Camp (I), Springfield Girls Camp (J), Westover Industrial Park (K), Wilbraham Country Club (L), Blandford Ski Area (M), East Longmeadow Industrial Park (N), East Longmeadow Rod and Gun Club (O), Edgewood Golf Course (P), Elmcrest Country Club (Q), Garden Plaza (R), Golden Acres Campground (S), Hampden Country Club (T). Display/hide their locations on the map
Shopping Centers: Ludlow Plaza Shopping Center (1), Ludlow Shopping Center (2), Meadowbrook Shopping Center (3), Ames-Big Y Shopping Center (4), North Main Shopping Center (5), Southwick Plaza Shopping Center (6), Stony Hill Plaza Shopping Center (7), The Shops at Gillett Corners Shopping Center (8), Boston Road Shopping Center (9).
Churches in Hampden County include: Westfield Evangelical Free Church (A), Wales Baptist Church (B), United Church of Christ (C), Union Church of Christ (D), Christ Lutheran Church (E), Christ the King Lutheran Church (F), Southwick Assembly of God Church (G), Saint Peter and Paul Ukranian Catholic Church (H), Saint Pauls United Methodist Church (I).
Cemeteries: South Quarter Cemetery (1), Tolland Cemetery (2), Dubois Cemetery (3), Brimfield Cemetery (4), The Old Cemetery (5), Grouts Cemetery (6), Prospect Hill Cemetery (7).
Lakes, reservoirs, and swamps: Minechoag Pond (A), Haviland Pond (B), Hayden Pond (C), Pork Barrel Pond (D), Bradley Pond (E), Trout Pond (F), Gamache Pond (G), Duck Pond (H).
Streams, rivers, and creeks: Ripley Brook (A), Japhet Brook (B), Ellis Brook (C), Halfway Brook (D), Vinica Brook (E), Babcock Brook (F), Palmer Brook (G), Moss Meadow Brook (H), Charles Brook (I).
Parks in Hampden County include: Red Bridge State Park (1), Ludlow Center Historic District (2), Watson Park (3), Leahy Field (4), Hampden Memorial Recreational Park (5), Laughing Brook Wildlife Sanctuary (6), Wilbraham Wildlife Area (7), Chester Center Historic District (8), Chester Factory Village Historic District (9).
Post offices: Brimfield Post Office (A), Blandford Post Office (B), Chester Post Office (C), Hampden Post Office (D), Southwick Post Office (E).
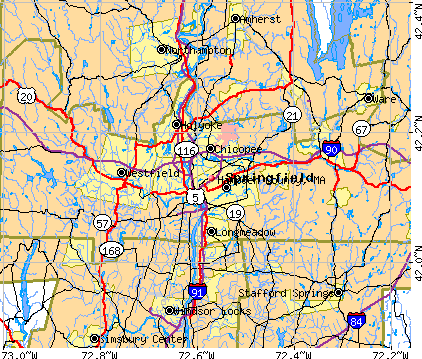
Neighboring counties: Hartford County, Connecticut , Berkshire County , Litchfield County, Connecticut , Tolland County, Connecticut , Hampshire County , Worcester County
Unemployment in Apr. 2010
Here: 10.4%
Massachusetts:
8.2%Hampden County: 7.2%Whole state: 12.2%
Year of entry for the foreign-born population
- 1995 to March 2000: 6,504
- 1990 to 1994: 5,244
- 1985 to 1989: 3,680
- 1980 to 1984: 2,271
- 1975 to 1979: 2,301
- 1970 to 1974: 2,473
- 1970 to 1974: 3,222
- 1965 to 1969: 7,338
- 1995 to March 2000: 6,504
- 1990 to 1994: 5,244
- 1985 to 1989: 3,680
- 1980 to 1984: 2,271
- 1975 to 1979: 2,301
- 1970 to 1974: 2,473
- 1970 to 1974: 3,222
- 1965 to 1969: 7,338
Mean travel time to work (commute): 21.8 minutes
Percentage of county residents living and working in this county: 81.8%
Housing units in structures:
- One, detached: 102,415
- One, attached: 8,182
- Two: 23,920
- 3 or 4: 14,333
- 5 to 9: 11,647
- 10 to 19: 6,267
- 20 or more: 16,189
- Mobile homes: 2,889
- Boats, RVs, vans, etc.: 34
- One, detached: 102,415
- One, attached: 8,182
- Two: 23,920
- 3 or 4: 14,333
- 5 to 9: 11,647
- 10 to 19: 6,267
- 20 or more: 16,189
- Mobile homes: 2,889
- Boats, RVs, vans, etc.: 34
Housing units in Hampden County with a mortgage: 61,595 (5,242
second mortgage, 9,327
home equity loan, 232
both second mortgage and home equity loan)Houses without a mortgage: 28,865
Here: 68.1%
with mortgage
State: 71.6% with mortgage
Religion statistics:
Percentage of population affiliated with a religious congregations: 64.76%
Here: 64.8%
USA: 50.2%
Total adherents: 295,436Total congregations: 247
Food Environment Statistics:
Number of grocery stores: 90
This county: 1.95 / 10,000 pop.Massachusetts: 1.98 / 10,000 pop.
Number of supercenters and club stores: 2
Hampden County:
0.04 / 10,000 pop.
State: 0.05 / 10,000 pop.
Number of convenience stores (no gas): 86
Hampden County: 1.87 / 10,000 pop.
Massachusetts: 2.22 / 10,000 pop.
Number of convenience stores (with gas): 112
This County: 2.43 / 10,000 pop.
Massachusetts: 1.77 / 10,000 pop.
Number of full-service restaurants: 335
Hampden County:
7.27 / 10,000 pop.
Massachusetts: 8.76 / 10,000 pop.
Adult diabetes rate:
Here: 9.2%
Massachusetts: 8.1%
Adult obesity rate:
Here: 25.9%
Massachusetts: 22.5%
Low-income preschool obesity rate:
Hampden County: 16.2%
State: 16.5%
Agriculture in Hampden County:
Average size of farms: 82 acresAverage value of agricultural products sold per farm: $51,717Average value of crops sold per acre for harvested cropland: $1842.61The value of nursery, greenhouse, floriculture, and sod as a percentage of the total market value of agricultural products sold: 40.33%The value of livestock, poultry, and their products as a percentage of the total market value of agricultural products sold: 14.73%Average total farm production expenses per farm: $45,247Harvested cropland as a percentage of land in farms: 29.12%Irrigated harvested cropland as a percentage of land in farms: 7.98%Average market value of all machinery and equipment per farm: $35,433The percentage of farms operated by a family or individual: 84.72%Average age of principal farm operators: 55 yearsAverage number of cattle and calves per 100 acres of all land in farms: 7.24Milk cows as a percentage of all cattle and calves: 42.31%Vegetables: 887 harvested acresLand in orchards: 589 acres
Tornado activity:
Hampden County historical area-adjusted tornado activity is near
Massachusetts state average. It is 1.5 times above
overall U.S. average.
Tornadoes in this county have caused one injury
recorded between 1950 and 2004.
On 8/10/1979, a category 1 (max. wind speeds 73-112 mph) tornado injured one person
and caused between $5000 and $50,000 in damages.
Earthquake activity:
Hampden County-area historical earthquake activity is below
Massachusetts state average. It is 88% smaller
than the overall U.S. average.
On
10/2/1994 at
11:27:22, a magnitude 3.7 (3.5 LG, 3.7 LG,
Depth: 6.2 mi,
Class: Light,
Intensity: II - III) earthquake occurred 21.4
miles away from the county centerOn 6/16/2000
at 04:02:53,
a magnitude 3.3 (3.3 LG,
Depth: 6.1 mi) earthquake occurred 12.9 miles
away from the county centerOn 10/2/1994
at 14:36:36,
a magnitude 3.3 (3.1 LG, 3.3 LG,
Depth: 6.2 mi) earthquake occurred 24.2 miles
away from the county centerOn 10/6/1992
at 15:38:04, a magnitude 3.4 (3.4 LG,
Depth: 3.1 mi) earthquake occurred 96.9 miles
away from Hampden County centerOn 3/22/1996
at 20:22:12,
a magnitude 3.1 (3.1 MD, 3.1 LG,
Depth: 7.4 mi) earthquake occurred 74.8 miles
away from the county centerOn 7/24/2007
at 01:56:48,
a magnitude 3.1 (3.1 MD, 2.7 LG,
Depth: 9.3 mi) earthquake occurred 85.7 miles
away from the county centerMagnitude types: regional Lg-wave magnitude (LG), duration magnitude (MD)
Percentage of residents relocating from other counties or countries Top counties from which taxpayers relocated into this county between 2005 and 2006:
from Hampshire County, MA 0.78% ($35,301 average AGI)
from Worcester County, MA 0.29% ($43,516)from Hartford County, CT 0.27% ($45,440)from Middlesex County, MA 0.14% ($46,504)from Franklin County, MA 0.09% ($35,603)from Essex County, MA 0.07% ($29,134)from Suffolk County, MA 0.07% ($34,825)
Hampden County:
0.04 / 10,000 pop.
State: 0.05 / 10,000 pop.
4.29% of this county's 2005 resident taxpayers moved to other counties in 2006 ($40,647 average adjusted gross income)
Here: 4.29%
Massachusetts average: 6.91%
0.07% of residents moved to foreign countries ($430 average AGI)
Hampden County: 0.07%
Massachusetts average: 0.11%
1.64% relocated to other counties in Massachusetts ($14,634 average AGI)
2.58% relocated to other states ($25,583 average AGI)
Hampden County: 2.58%
Massachusetts average: 3.26%
Percentage of residents relocating to other counties or countries
to Hampshire County, MA 0.77% ($38,198 average AGI)
to Hartford County, CT 0.38% ($47,087)to Worcester County, MA 0.25% ($38,860)to Middlesex County, MA 0.16% ($36,554)to Suffolk County, MA 0.11% ($32,611)to Franklin County, MA 0.08% ($30,775)to Tolland County, CT 0.07% ($68,058)
Births per 1000 population in Hampden County
Births per 1000 population from 1990 to 1999:
14.0Births per 1000 population from 2000 to 2006:
12.6
Deaths per 1000 population in Hampden County
Deaths per 1000 population from 1990 to 1999:
10.1Deaths per 1000 population from 2000 to 2006:
10.0
Infant deaths per 1000 live births in Hampden County
Infant deaths per 1000 live births from 1990 to 1999:
7.4Infant deaths per 1000 live births from 2000 to 2006:
6.3
Persons enrolled in hospital insurance and/or supplemental medical insurance (Medicare) in July 1, 2003:
76,370 (62,597
aged,
13,773 disabled)Population without health insurance coverage in 2000:
13%Children under 18 without health insurance coverage in 2000:
8%
Short term general hospitals per 100,000 population in 2004:
1.08Short term general hospital admissions per 100,000 population in 2004:
13316.83Short term general hospital beds per 100,000 population in 2004:
272.6Emergency room visits per 100,000 population in 2004:
46082.23
General practice office based MDs per 100,000 population in 2005:
1246.340Medical specialist MDs per 100,000 population in 2005:
993.520Dentists per 100,000 population in 1998:
24.26
Total births per 100,000 population, July 2005 - July 2006 :
55.96Total deaths per 100,000 population, July 2005 - July 2006:
82.32
Limited-service eating places per 100,000 population in 2005 :
12.35Beer, wine & liquor stores per 100,000 population in 2005:
1
Size of family households:
46,250
2-persons,
28,203
3-persons, 24,353
4-persons, 11,460
5-persons, 4,241
6-persons, 2,063
7-or-more-persons.
Size of nonfamily households:
49,698
1-person,
7,877
2-persons,
746
3-persons,
428
4-persons,
99
5-persons,
37
6-persons,
20
7-or-more-persons.
77.7% of residents of Hampden County speak English at home.12.9%
of residents speak Spanish at home (57%
speak English very well, 22%
speak English well,
14% speak English not well,
7% don't speak English at all).7.8% of residents speak other Indo-European language at home (60% speak English very well,
21% speak English well,
15% speak English not well,
4% don't speak English at all).1.1%
of residents speak Asian or Pacific Island language at home (44%
speak English very well, 32%
speak English well,
20% speak English not well,
4% don't speak English at all).0.4% of residents speak other language at home (73% speak English very well,
16% speak English well, 10%
speak English not well).
In fiscal year 2004:
Federal Government expenditure:
$3,115,782,000 ($6746 per capita)Department of Defense expenditure:
$216,155,000Federal direct payments to individuals for retirement and disability:
$1,132,031,000Federal other direct payments to individuals:
$684,131,000Federal direct payments not to individuals:
$14,383,000Federal grants:
$771,155,000Federal procurement contracts:
$198,705,000 ($70,870,000 Department of Defense)Federal salaries and wages:
$315,378,000 ($64,596,000 Department of Defense)Federal Government direct loans:
$43,314,000Federal guaranteed/insured loans:
$181,959,000Federal Government insurance:
$131,811,000
Population change from April 1, 2000 to July 1, 2005:
Births: 30,168
Here: 65 per 1000 residents
State: 67 per 1000 residents
Deaths:
24,209
Net international migration: +6,986
Here: +15 per 1000 residents
State:+25 per 1000 residents
Net internal migration: -7,093
Here: -15 per 1000 residents
State:-37 per 1000 residents
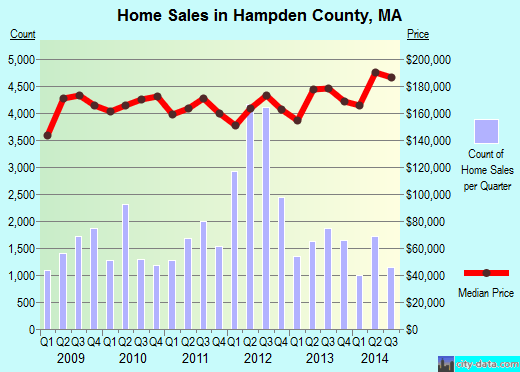
Population Growth in Hampden CountyTotal withdrawal of fresh water for public supply:
53.57
millions of gallons per day (13%
from ground,
87%
from surface)
Median number of rooms in houses and condos:
Here: 6.0
State: 6.4
Median number of rooms in apartments:
Here: 4.1
State: 4.0
Year house built
- 2005 or later: 1,802
- 2000 to 2004: 4,499
- 1990 to 1999: 10,860
- 1980 to 1989: 16,354
- 1970 to 1979: 22,787
- 1960 to 1969: 22,495
- 1950 to 1959: 31,203
- 1940 to 1949: 16,229
- 1939 or earlier: 64,422
- 2005 or later: 1,802
- 2000 to 2004: 4,499
- 1990 to 1999: 10,860
- 1980 to 1989: 16,354
- 1970 to 1979: 22,787
- 1960 to 1969: 22,495
- 1950 to 1959: 31,203
- 1940 to 1949: 16,229
- 1939 or earlier: 64,422
Place of birth for U.S.-born residents:
- This state:
307037
- Northeast:
56015
- Midwest:
7426
- South:
16309
- West:
4727
- This state: 307037
- Northeast: 56015
- Midwest: 7426
- South: 16309
- West: 4727
Here: 10.6%
State: 10.8%
Students in private schools in grades 9 to 12 (high school):
2,298
Here: 8.4%
State: 12.2%
Students in private undergraduate colleges:
8,004
Here: 33.7%
State: 48.2%
Private Mortgage Insurance Companies Aggregated Statistics For Year 2009
(Based on 77 full tracts)
A
ConventionalHome Purchase Loans
B
Refinancings
C
Non-occupant Loans on < 5 Family Dwellings (A & B)
LOANS ORIGINATED
- Number - 341
- Average Value - $203,654
- Number - 341
- Average Value - $203,654
APPLICATIONS APPROVED, NOT ACCEPTED
- Number - 96
- Average Value - $217,146
- Number - 96
- Average Value - $217,146
APPLICATIONS DENIED
- Number - 61
- Average Value - $199,787
- Number - 61
- Average Value - $199,787
APPLICATIONS WITHDRAWN
- Number - 12
- Average Value - $185,750
- Number - 12
- Average Value - $185,750
FILES CLOSED FOR INCOMPLETENESS
- Number - 5
- Average Value - $154,200
- Number - 5
- Average Value - $154,200
LOANS ORIGINATED
- Number - 239
- Average Value - $219,322
- Number - 239
- Average Value - $219,322
APPLICATIONS APPROVED, NOT ACCEPTED
- Number - 89
- Average Value - $222,045
- Number - 89
- Average Value - $222,045
APPLICATIONS DENIED
- Number - 94
- Average Value - $226,202
- Number - 94
- Average Value - $226,202
APPLICATIONS WITHDRAWN
- Number - 20
- Average Value - $258,200
- Number - 20
- Average Value - $258,200
FILES CLOSED FOR INCOMPLETENESS
- Number - 5
- Average Value - $189,600
- Number - 5
- Average Value - $189,600
LOANS ORIGINATED
- Number - 1
- Average Value - $431,000
- Number - 1
- Average Value - $431,000
APPLICATIONS APPROVED, NOT ACCEPTED
- Number - 1
- Average Value - $131,000
- Number - 1
- Average Value - $131,000
APPLICATIONS DENIED
- Number - 1
- Average Value - $84,000
- Number - 1
- Average Value - $84,000
APPLICATIONS WITHDRAWN
- Number - 1
- Average Value - $109,000
- Number - 1
- Average Value - $109,000
FILES CLOSED FOR INCOMPLETENESS
- Number - 0
- Average Value - $0
- Number - 0
- Average Value - $0
Businesses in Hampden County, MA
Name
7-ElevenAMF BowlingAT&TAbercrombie & Fitch Abercrombie Kids AeropostaleAnn TaylorApple StoreArby'sAutoZoneBath & Body Works Bed Bath & Beyond BlockbusterBrookstoneBurger KingClarionComfort InnCostco
Dairy QueenDays InnDecora CabinetryDennysDomino's PizzaDunkin DonutsEcono LodgeFedExFoot LockerGNC 7GameStopGapH&R BlockHoliday InnHollister Co.Home DepotHoward JohnsonIHOPJCPenneyKFCKmartKnights InnKohl'sLENSCRAFTERSLa-Z-Boy
Count
4251
122127214181113282550354178216314222931123
Name
Lane FurnitureLowesMacy'sMarriottMarshallsMasterBrand CabinetsMcDonald'sMotel 6Outback SteakhousePanda ExpressPanera BreadPaylessPizza HutPopeyesQualityQuiznosRadioShackRaymour & FlaniganRed RobinRite AidRuby TuesdaySearsSephoraSpencer GiftsSprint NextelStaplesStarbucksSubwaySuper 8T-MobileT.J.MaxxTaco BellTargetToys"R"UsTravelodgeUPSVerizon WirelessVictoria's SecretWalgreensWalmartWendy'sYMCA
Count
412124124111382122722925113564211227151646111386
Hampden County on our top lists:
#24 on the list of "Top 101 counties with the lowest percentage of residents relocating from other counties between 2005 and 2006"#25 on the list of "Top 101 counties with the highest Ozone (1-hour) air pollution readings in 2005 (ppm)"#36 on the list of "Top 101 counties with the highest percentage of residents that smoked 100+ cigarettes in their lives"#40 on the list of "Top 101 counties with the lowest percentage of residents relocating to other counties in 2006"#41 on the list of "Top 101 counties with the largest number of people moving out compared to moving in (pop. 50,000+)"#61 on the list of "Top 101 counties with the highest Nitrogen Dioxide air pollution readings in 2005 (ppm)"#62 on the list of "Top 101 counties with the highest Sulfur Oxides Annual air pollution readings in 2005 (µg/m3)"#71 on the list of "Top 101 counties with the highest average weight of females"#73 on the list of "Top 101 counties with the highest carbon monoxide air pollution readings in 2005 (ppm)"#79 on the list of "Top 101 counties with the highest Ozone (8-hour) air pollution readings in 2005 (ppm)"

Home sales trends information powered by Onboard Informatics
© 2010 Onboard Informatics. Information is deemed reliable but not guaranteed.
City-data.com does not guarantee the accuracy or timeliness of any information on this site. Use at your own risk.
Website © 2003-2010 Advameg, Inc.